E-Commerce Strategies
Want to crush your Q4 sales on Amazon FBA? It all starts with precise holiday demand forecasting. Here's the deal: the holiday season can make or break your year. Predict demand too low, and you'll face stockouts, losing sales and Prime eligibility. Predict too high, and you'll rack up costly storage fees - especially with Amazon's holiday storage rates doubling from October 15 to January 14.
Here’s a quick breakdown of how to forecast demand effectively:
Analyze Past Sales: Use historical Q4 data and Prime Day performance to spot trends and identify top-selling products. Focus on items with consistent growth and high ROI.
Factor in Growth: Adjust last year’s numbers by applying a 20% year-over-year growth rate, a common benchmark for holiday sales.
Account for Seasonal Spikes: Prime events and Black Friday can double or triple daily sales. Use seasonal multipliers to estimate peak demand.
Plan for Logistics: Production and shipping delays can stretch lead times to 75–80 days. Build in safety stock to avoid running out during the rush.
Validate with Tools: Use tools like Amazon’s Demand Forecast Tool, Jungle Scout, or Fluvi Inventory Planner to cross-check your projections.
Key Deadlines:
Prime Big Deal Days: Have inventory arrive by September 20–25, 2026.
Black Friday/Cyber Monday: Ensure stock reaches FBA by October 20–25, 2026.
Christmas Delivery: Plan for arrivals by December 8–12, 2026.
Forecasting isn’t just about numbers - it’s about staying ahead of deadlines and competition. Start early, stay data-driven, and prepare for unexpected spikes to dominate Q4 sales.
How To Perform Amazon Sales Forecasting And Inventory Projection For FBA Sellers
Step 1: Review Your Past Q4 Sales Data
To forecast accurately, start by analyzing your historical Q4 sales data. Focus on last year’s Q4 performance and your most recent Prime Day results - these provide a clear view of how your products perform during high-demand periods.
Pull Historical Sales Reports
Begin by accessing Seller Central > Reports > Fulfillment to download the Inventory Ledger Report. This report tracks your inventory movement, including starting balances, received units, customer orders, and returns. Pair it with the FBA Inventory Report (Inventory > FBA Inventory) to see Amazon's suggested minimum stock levels based on prior performance. Additionally, check the Deals Dashboard (Advertising > Deals) to evaluate which promotions led to peak sales, such as $500 Lightning Deals or $1,000 Best Deals.
For a broader overview, use the FBA Dashboard (Inventory > FBA Dashboard). It provides a snapshot of key Amazon seller metrics, shipments, and inventory opportunities. Combining these reports gives you a comprehensive understanding of last year’s trends.
Identify Your Best-Selling Products
Focus on products with a Best Sellers Rank (BSR) between 1 and 200,000, as these are your top performers. Prioritize items that achieved an ROI above 15% and net margins over 10%, even after Amazon’s holiday peak fulfillment fees (which start on October 15). Look for SKUs that showed consistent growth year-over-year; many brands experience around 20% holiday growth annually, which can serve as a benchmark.
Be sure to eliminate anomalies like stockouts or one-time sales spikes to avoid skewed forecasts. Also, review your Inventory Performance Index (IPI) from last year. A score between 400 and 800 indicates effective management of sell-through rates and excess inventory.
Spot Recurring Patterns
Examine when demand surged. Prime events often lead to 2–3× daily sales volume, while Black Friday and Cyber Monday typically boost Q4 sales by 15–20% compared to Q3. Pinpoint the weeks when sales doubled or quadrupled and note the duration of these peaks. Use this data to calculate safety stock with the formula: (Maximum daily sales × Maximum lead time) – (Average daily sales × Average lead time).
Don’t forget to factor in returns. Holiday return rates average 16–17%, but for categories like apparel, returns can exceed 30% in January. Review last year’s return reasons and volumes to adjust your inventory strategy. Also, compare planned versus actual shipment arrival dates - if a typical 60-day lead time stretched to 75–80 days during the holiday rush, include that buffer in your planning.
Step 2: Apply Growth Rates and Seasonal Multipliers
Now that you've gathered your historical data, it's time to adjust those figures for growth trends and seasonal sales spikes. Using last year's Q4 data as your foundation, you'll need to account for both current growth rates and the impact of holiday-specific demand surges. Raw sales figures alone won’t cut it - they need to reflect current market conditions and seasonal peaks.
Factor in Year-over-Year Growth
Start by calculating your year-to-date (YTD) growth compared to the previous year. Many Amazon brands typically see around 20% growth during the holiday season. If your sales performance aligns with this trend, apply a similar growth rate to your Q4 data from last year. For instance, if you sold 5,000 units of a product in Q4 2025 and you're experiencing a 20% growth rate in 2026, your updated forecast would be 6,000 units (5,000 × 1.20). This adjustment ensures your forecast aligns with your current growth trajectory.
To further refine your numbers, you can use Amazon's Demand Forecast Tool in Seller Central. This tool predicts demand for up to 40 weeks based on historical orders, active deals, and seasonal trends, offering an additional layer of validation for your projections.
Once you've adjusted for growth, it's time to incorporate the effects of holiday-specific demand spikes.
Apply Seasonal Demand Multipliers
Holiday events tend to create sharp, concentrated sales spikes rather than steady increases. For example, Prime events can double or even triple your average daily sales, while Black Friday and Cyber Monday (BFCM) typically boost Q4 sales by 15–20% compared to Q3. To forecast peak demand, multiply your growth-adjusted baseline by these seasonal multipliers.
Let’s break it down: if your daily average is 200 units, sales could jump to 400–600 units during Prime Big Deal Days (e.g., October 8–9, 2026). Similar surges often occur during BFCM week (e.g., November 27–30, 2026). To ensure you're prepared, calculate your total inventory needs as follows: (Daily Sales × Lead Time) plus a safety stock buffer. Given the potential for order volumes to double or even quadruple, it's wise to include a 14–21 day safety stock buffer to avoid stockouts during unexpected demand spikes.
The table below outlines event-specific multipliers and recommended FBA arrival dates to help you plan effectively:
Event/Factor | Expected Multiplier/Lift | Recommended FBA Arrival Date |
|---|---|---|
Year-over-Year Growth | ~20% increase | Apply to previous year's baseline |
Prime Events | 2× – 3× daily sales | Before September 10, 2026 |
BFCM Week | 15% – 20% lift over Q3 | Before October 20, 2026 |
General Holiday Peak | 2× – 4× volume | Before December 1, 2026 |
Step 3: Account for Market Trends and External Factors
While historical data and growth projections give you a foundation, external market forces can shift your forecasts by as much as 10–15%. Factors like economic conditions, new product trends, and competitor activity all play a role in shaping customer behavior during Q4. Overlooking these elements can result in either running out of stock or being stuck with excess inventory. Stay on top of these trends and adjust your inventory forecast as needed.
Track Industry Trends
Start by keeping an eye on Amazon's Best Sellers list in your category to identify products gaining momentum as the holiday season nears. Tools like Google Trends can help you spot changes in search behavior - an early spike in searches for specific items often signals growing demand. Use forecasting tools to fine-tune your predictions further.
Dive into your customer search term reports in Seller Central and compare them with insights from Google Keyword Planner. If you notice holiday-related searches picking up earlier than usual, it might be time to adjust your Amazon PPC strategy. Adding seasonal and long-tail keywords early can help you capture demand before the peak hits. Make it a habit to check these data sources weekly, starting as early as August, so you can place inventory orders well in advance.
By combining market trends with broader economic indicators, you’ll have a clearer picture of Q4 dynamics.
Consider Economic and Consumer Behavior Changes
Beyond industry trends, economic factors like inflation and shifts in disposable income also influence how customers shop. When economic pressures rise, you might see smaller basket sizes, more price-sensitive shoppers, and lower conversion rates. For example, Amazon Business Reports could show increased sessions and add-to-cart rates but lower conversions. In these cases, dynamic pricing becomes essential to protect your margins during demand surges.
Holiday shopping behaviors also evolve - customers tend to shop earlier, and return rates spike (averaging 16–17%, with apparel reaching as high as 30%). Use your Detail Page Sales and Traffic reports to track key metrics like page views, add-to-cart rates, and wishlist activity. If engagement in September exceeds expectations, consider increasing your forecast by 10–15%. Stay flexible, as external factors can shift quickly, requiring you to adapt on the fly.
Step 4: Calculate Inventory Needs and Add Safety Stock
Turn your forecast into clear inventory numbers. Ordering too little can lead to stockouts and ranking penalties, while ordering too much racks up expensive storage fees.
Calculate Total Units Needed
Using your refined forecast, translate demand into the exact number of inventory units required to handle holiday peaks. Start by determining total units per SKU based on your adjusted forecast and lead time. To calculate, multiply your average daily demand by the total number of lead time days. Be sure to include all delays - supplier, shipping, customs, and FBA processing. For example, if peak demand is 120 units per day over 75 days, you’ll need 9,000 units.
During Q4, production and shipping times often increase by 15–20%, so plan accordingly. Work backward from Amazon's inbound cutoffs - usually late October for Black Friday and Cyber Monday - and add extra time for customs, trucking delays, and prep center processing (1–5 days). To stay safe, schedule deliveries at least 7 days before Amazon’s deadlines to account for potential carrier issues.
Once you’ve calculated total units, add a safety cushion to handle unexpected fluctuations.
Add Safety Stock
Safety stock is your buffer against demand spikes and lead time delays. It’s critical - even a 3-day stockout can suppress your search visibility for 2 to 3 weeks, and over 30% of shoppers will buy from a competitor rather than wait for a restock.
The most accurate way to calculate safety stock is by using the Combined Demand and Lead Time Variability Formula, which factors in both sales velocity and shipping reliability. Start by measuring demand variability using 60 to 90 days of clean daily sales data, excluding anomalies like flash sales unless they’re likely to repeat. Then, assess lead time variability by analyzing the standard deviation of delivery times from your last 20 to 30 purchase orders. Multiply average demand and its variability by your peak factor (e.g., 4× for a jump from 30 to 120 units/day) to determine peak safety stock.
Adjust your safety stock levels based on SKU importance:
A-tier products (top 20% of revenue): Target a 97% to 99% service level.
B-tier products (next 30%): Aim for 94% to 96%.
C-tier products (bottom 50%): Keep it at 88% to 92% to conserve capital.
For reference, a 95% service level means you’ll have stock for 95 out of every 100 replenishment cycles. To stay competitive during the holiday rush, aim for 4–6 weeks of inventory coverage as safety stock. This buffer ensures you can handle unexpected demand or shipping delays without risking penalties or losing your edge in search rankings.
Step 5: Verify Your Forecast with Tools and Metrics
Once you've calculated your inventory needs and defined your safety stock, it's time to verify your forecast. Using reliable tools and metrics to cross-check your numbers can help you catch potential errors before they impact your Q4 performance.
Use Forecasting Tools
Leverage tools like Amazon Seller Central reports, Jungle Scout, Fluvi Inventory Planner, or Amazon Forecast to validate your inventory forecast. These tools, combined with key performance indicators (KPIs), help refine your forecast, ensuring it aligns with historical data and actionable insights.
Jungle Scout's Inventory Manager simplifies the process by categorizing your SKUs as "Reorder Now", "Reorder Soon", "Overstock", or "In Stock." It uses sales trends and supplier lead times to automate analysis, making it easier to spot any discrepancies between your manual calculations and the data-driven recommendations.
Fluvi Inventory Planner employs a "Growth Modifier" formula to compare sales from the last six months to the same period in the previous year. For example, a growth modifier of 1.1 indicates 10% growth, while 0.83 reflects a 17% drop in demand. By excluding one-off sales spikes and accounting for "missed sales" caused by stockouts, you can build a more accurate baseline that reflects organic demand.
For more advanced needs, Amazon Forecast (AWS) offers probabilistic forecasts at three levels: 10%, 50%, and 90%. This allows you to weigh the risks of overstocking against the risk of stockouts. By combining time series data with variables like pricing, promotions, and even local weather patterns (via its Weather Index), Amazon Forecast claims to be up to 50% more accurate than non-machine learning tools.
Monitor Key Performance Indicators
Key metrics like days of coverage can help you verify the accuracy of your forecast. To calculate this, divide your current stock by your forecasted daily sales. For example, if you have 180 days of inventory but planned for 90, your forecast may have been too conservative. On the flip side, if you’re down to 30 days of stock before the holiday rush, you've underestimated demand. Set a target - such as 60, 90, or 180 days - based on your cash flow and tolerance for storage fees, then use your forecasting tools to adjust accordingly.
Keep an eye on your sell-through rate and inventory turnover on a weekly basis during Q4. If actual sales are running 15–20% higher or lower than predicted, recalculate your forecast immediately. Consolidate data from FBA and 3PL providers to get a complete picture of your total stock, as fragmented data can lead to poor decisions. Additionally, track your forecast's accuracy using the Mean Absolute Percentage Error (MAPE). A MAPE below 10% is considered solid, while anything above 50% suggests your forecast needs serious adjustments. Monitoring these KPIs closely allows you to make quick changes and keep your Q4 performance on track.
Holiday FBA Shipping Timeline and Deadlines
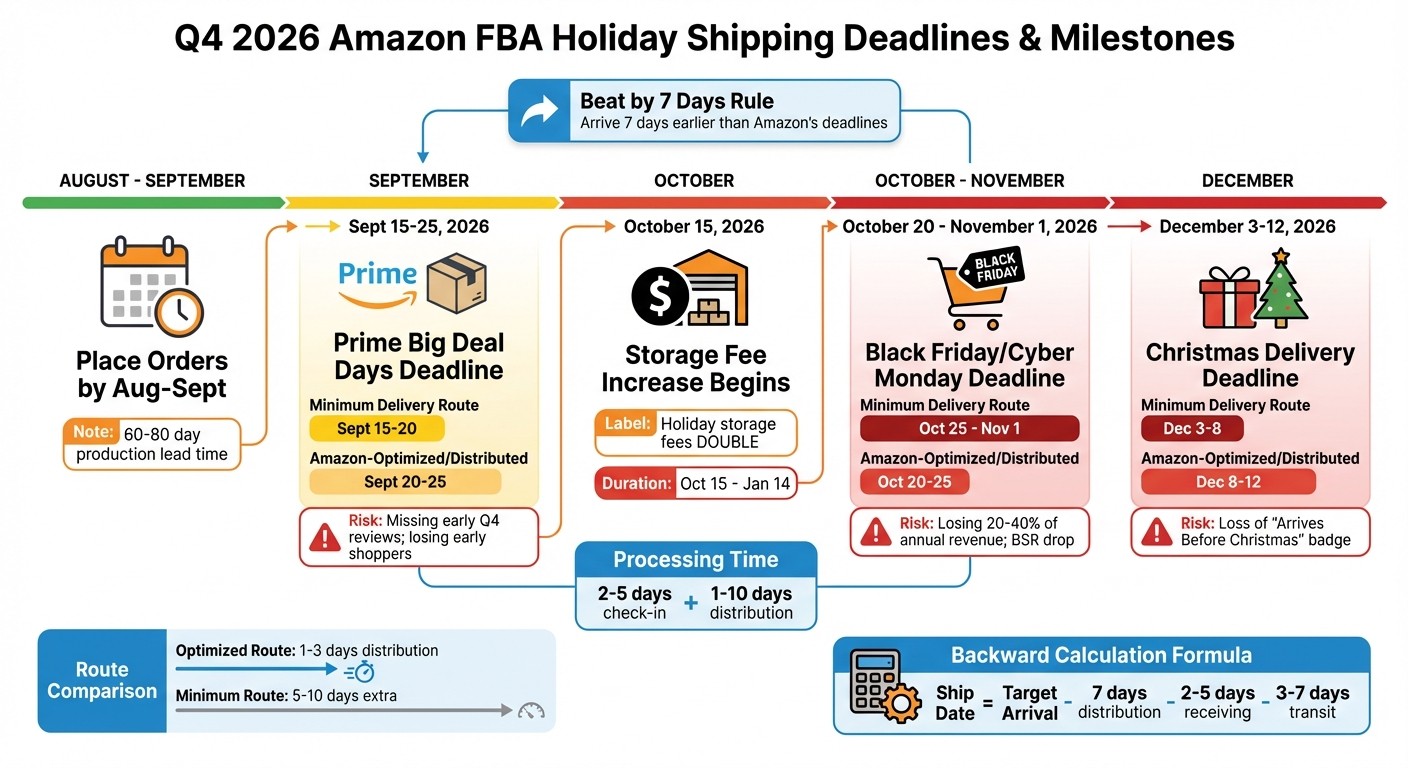
Amazon FBA Holiday Shipping Deadlines and Inventory Timeline for Q4 2026
Getting your inventory to Amazon on time is absolutely crucial for success during Q4. A delayed shipment could cost you as much as 20–40% of your annual revenue during Black Friday and Cyber Monday alone.
Here’s the thing: inventory doesn’t go live the moment it arrives at Amazon. It first goes through a 2–5 day check-in process and then a 1–10 day distribution phase, which can stretch even longer - sometimes over 7 days - during peak seasons. During the busy fulfillment fee window (October 15, 2026, through January 14, 2027), these queues can become even more congested. That’s why experienced sellers swear by the "Beat by 7 Days" Rule: aim for your inventory to arrive at least 7 days earlier than Amazon’s recommended deadlines to account for potential carrier delays and fulfillment center backlogs.
The Role of Inbound Routes in Meeting Deadlines
Your choice of inbound shipping route has a big impact on timing.
Amazon-optimized or distributed routes: These send inventory to multiple fulfillment centers upfront, cutting distribution time to just 1–3 days.
Minimum delivery routes: These ship to only one or two fulfillment centers, which adds 5–10 extra days for redistribution.
For Black Friday and Cyber Monday, shipments using optimized routes should arrive between October 20 and 25, while shipments on minimum delivery routes should target October 25 to November 1. While distributed routes may cost an extra $50–$200, the investment is often worth it - stockouts during peak periods can lead to losses in the five-figure range.
Key Holiday Shipping Deadlines
Holiday Event | Amazon-Optimized/Distributed Arrival | Minimum Delivery Arrival | Risk of Missing Deadline |
|---|---|---|---|
Prime Big Deal Days | Sept 20–25, 2026 | Sept 15–20, 2026 | Missing early Q4 reviews; losing early shoppers |
Black Friday/Cyber Monday | Oct 20–25, 2026 | Oct 25–Nov 1, 2026 | Losing 20–40% of annual revenue; drop in Best Seller Rank |
Christmas Delivery | Dec 8–12, 2026 | Dec 3–8, 2026 | Loss of "Arrives Before Christmas" badge; lower conversion |
How to Calculate Your Ship Date
To determine when you need to ship your inventory, work backward from your target arrival date:
Subtract 7 days for distribution.
Subtract 2–5 days for Amazon’s receiving process.
Subtract 3–7 days for transit time.
For example, if you’re aiming for an optimized route arrival by October 20, your shipment should leave your warehouse between October 13 and 18 to include a safety buffer.
If you’re using Amazon Warehousing and Distribution (AWD), factor in an additional 7–10 days for transfers into the FBA network. AWD deadlines are the earliest of the season and can help you avoid FBA storage changes and capacity issues during peak times.
With these timelines in mind, it’s time to align your vendor schedules and transportation plans to ensure everything runs smoothly.
Work with eStore Factory for Better Forecasting
Once your forecast is fine-tuned, you can take it to the next level with expert guidance. Predicting holiday demand is no small feat - it requires both deep marketplace knowledge and the ability to integrate data from multiple sources. That’s where eStore Factory steps in, offering a full suite of Amazon demand planning services. From account management to SEO consulting and PPC strategies, they help sellers stay ahead of demand fluctuations.
One standout tool in their arsenal is the reverse ASIN tool, which uncovers competitor keywords and identifies trending search terms. This isn’t just about knowing what shoppers are searching for now - it’s about anticipating what they’ll be searching for when shopping traffic peaks on Black Friday and Cyber Monday. By adjusting PPC bids based on these insights, sellers can attract high-intent shoppers during busy periods while avoiding unnecessary ad spend during slower times. This competitive edge complements data-driven forecasting with real-time market insights.
Another valuable resource is the Amazon Attribution API, which tracks how external marketing efforts - like Google Ads or Facebook campaigns - impact sales on Amazon. This cross-channel visibility helps identify the most effective traffic sources, enabling sellers to refine their forecasts by accounting for external campaigns and social media promotions that drive additional sales.
eStore Factory also performs account audits to analyze historical performance trends. These audits highlight recurring patterns and uncover growth opportunities, from seasonal sales spikes to advertising performance metrics. Armed with this data, sellers gain a clearer understanding of which SKUs will shine during Q4 and how much inventory they’ll need to meet demand.
But it’s not just about the numbers. eStore Factory also handles operational tasks, such as enhancing listings with Premium A+ Content and managing Sponsored Products, Brands, and DSP campaigns. This hands-on support ensures that your forecast doesn’t just sit in a spreadsheet - it turns into actionable strategies that drive sales.
Conclusion
Getting holiday demand forecasting right is more than just avoiding stockouts - it’s about staying ahead of your competition during the busiest time of the year. Every stockout means lost sales to competitors, while overstocking ties up your cash and doubles storage costs between October 15 and January 14. These challenges highlight why precise forecasting is so important.
"Q4 success depends on timely shipments, precise forecasting, and proactive inventory management." - Sean Weeks, eFulfillment Service
Let’s recap the five-step framework: start by analyzing historical data, apply growth rates, factor in market trends with Amazon marketing services, calculate safety stock, and validate your plan with forecasting tools. Use last year’s Q4 performance and recent Prime Day results as your foundation, applying a standard 20% year-over-year growth rate. Plan backward from Amazon’s inbound deadlines, keeping in mind that production runs during peak season can take 60 to 80 days. This means placing orders by August or September - not October. Following this structured, data-driven approach ensures you hit Amazon’s deadlines and maintain Prime eligibility.
Success in Q4 is all about preparation. Missing inbound deadlines could cost you Prime eligibility during the busiest shopping days. Running out of stock means losing market share, Buy Box control, and revenue that you can’t recover. By adopting these forecasting strategies now, you’ll be ready to tackle the holiday season with confidence and secure your place in the competitive holiday market.
FAQs
How do I forecast Q4 demand for a new SKU with little sales history?
To predict Q4 demand for a new SKU with limited sales data, start by examining seasonal trends, market insights, and external influences like holidays. Look at industry benchmarks and apply seasonal multipliers from comparable products or categories to fill in the gaps. Tools such as Amazon Brand Analytics can provide valuable insights by analyzing past seasonal sales patterns. By combining these data points, you can create a more precise demand forecast, helping to fine-tune inventory planning and marketing efforts during the high-demand Q4 season.
What’s the best way to balance safety stock vs. Amazon’s higher holiday storage fees?
To manage safety stock effectively during Amazon's higher holiday storage fee period, use a mix of historical data, market trends, and forecasting tools to predict demand. Aim to maintain a buffer stock that prevents stockouts without overloading inventory, as fees rise significantly from mid-October to mid-January. Ship your inventory early to sidestep potential delays, and keep a close eye on stock levels throughout the season. This helps you adjust safety stock as needed, ensuring you meet customer demand while keeping storage costs in check.
How do I turn Amazon’s inbound deadlines into my actual order and ship dates?
To keep your orders and shipments in sync with Amazon’s inbound deadlines, take time to review their shipping timelines and plan your logistics carefully. Make sure your inventory reaches Amazon’s fulfillment centers well in advance by factoring in transit times and any possible delays. Adjust your shipping schedule to ensure products are stocked ahead of high-demand periods, particularly during the holiday season. This approach reduces the risk of stockouts and helps maintain smooth, on-time fulfillment.